原理
如下图所示:
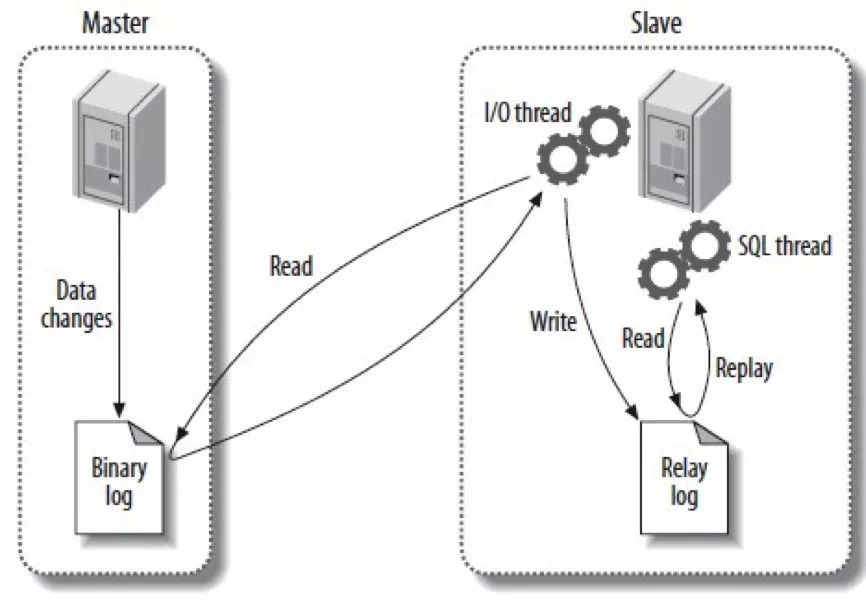
- Master将binlog推送给每个连接上来的slave
- Slave的IO线程将Master发送过来的binlog写入到本地的Relay log日志文件
- Slave的SQL线程读取relay log日志,apply里面的变更
具体可以参见:How does MySQL Replication really work?,非常深入浅出的一篇文章。
说明
1、MySQL5.5版本开始支持半同步复制
2、ORACLE MySQL 5.6版本又引入GTID(Global Transactions Identifier)、多线程复制:
- GTID: 在MySQL5.6以前对于主从复制出现问题有时候需要你分析BINLOG找到POS点,然后在CHANG MASTER TO。对于新手来说很容易犯错,造成主从复制错误。在5.6中,不必在需要寻找BINLOG和POS点了,你只需要知道MASTER的IP、密码、端口就可以,因为MySQL会从内部GTID机制自动找到同步点。
- 多线程复制: 在MySQL5.6之前,复制是单线程队列式的,只能一个一个运行。在新版中支持基于库的多线程复制,配置选项
slave_parallel_workers即可实现在slave上多线程并发复制。不过,它的并发粒度是库级别(database)而不是table级别,并不能真正做到多表并发复制。因此在较大并发负载时,slave还是没有办法及时追上master,需要想办法进行优化。 比如使用MariaDB发行版,它实现了相对真正意义上的并行复制,其效果远比ORACLE MySQL好的很多。如果不想用这个版本的话,那就老实等待官方5.7大版本发布吧。
同步方式
- statement-based replication (SBR) MySQL 3.23+
- row-based replication (RBR) MySQL 5.1+
- mixed
这里要特别强调一下RBR方式。因为它很容易产生Error_code: 1032; handler error HA_ERR_KEY_NOT_FOUND这类型的同步错误。这种错误的原因在于从库与主库因为某些原因存在不一致:
Basically, the slave should be always synchronized with its master having the same copy of data, but for some reasons there might be inconsistency between both of them (unsafe statement in SBR, Slave is not read_only and was modified apart of replication queries, .. etc) which causes errors and stops the replication, e.g. if the master inserted a record which was already inserted on the slave (Duplicate entry) or updated/deleted a row which was not exist on the slave, … etc.
Binary log execution errors and slave_exec_mode. If slave_exec_mode is IDEMPOTENT, a failure to apply changes from RBL because the original row cannot be found does not trigger an error or cause replication to fail. This means that it is possible that updates are not applied on the slave, so that the master and slave are no longer synchronized. Latency issues and use of nontransactional tables with RBR when slave_exec_mode is IDEMPOTENT can cause the master and slave to diverge even further. For more information about slave_exec_mode, see Section 5.1.4, “Server System Variables”.
然后如果从库配置的slave_exec_mode=STRICT而不是IDEMPOTENT,则任何同步语句失败都会引起主从同步停止。
所以如果真的允许主从不一致的情况,那么可以采用SBR方式,或者RBR但是设置slave_exec_mode=IDEMPOTENT。
slave_exec_mode Controls whether IDEMPOTENT or STRICT mode is used in replication conflict resolution and error checking. IDEMPOTENT mode causes suppression of duplicate-key and no-key-found errors.
主动同步失败处理
一般有两种方式:
- 跳过或者忽略引起错误的语句
- 重新搭建主从同步
具体操作比较case by case,可以参见:REPLICATION TROUBLESHOOTING - CLASSIC VS GTID。也可以参考笔者以前写过的几篇MySQL同步相关文章。
一些有用的命令和工具
- START SLAVE
- IO_THREAD
- SQL_THREAD
- STOP SLAVE
- IO_THREAD
- SQL_THREAD
- STOP SLAVE SQL_THREAD: MySQL 5.1.55+
- SHOW SLAVE STATUS
- mysqldump
- mysqlbinlog
- percona-toolkit
这里要特别强调一下show slave status命令,因为它是查看主从同步状态的入口,一定要真真切切的明白它的每一个输出的含义(SHOW SLAVE STATUS):
mysql> SHOW SLAVE STATUS\G
*************************** 1. row ***************************
               Slave_IO_State: Waiting for master to send event
                  Master_Host: localhost
                  Master_User: root
                  Master_Port: 3306
                Connect_Retry: 3
              Master_Log_File: gbichot-bin.005
          Read_Master_Log_Pos: 79
               Relay_Log_File: gbichot-relay-bin.005
                Relay_Log_Pos: 548
        Relay_Master_Log_File: gbichot-bin.005
             Slave_IO_Running: Yes
            Slave_SQL_Running: Yes
              Replicate_Do_DB:
          Replicate_Ignore_DB:
           Replicate_Do_Table:
       Replicate_Ignore_Table:
      Replicate_Wild_Do_Table:
  Replicate_Wild_Ignore_Table:
                   Last_Errno: 0
                   Last_Error:
                 Skip_Counter: 0
          Exec_Master_Log_Pos: 79
              Relay_Log_Space: 552
              Until_Condition: None
               Until_Log_File:
                Until_Log_Pos: 0
           Master_SSL_Allowed: No
           Master_SSL_CA_File:
           Master_SSL_CA_Path:
              Master_SSL_Cert:
            Master_SSL_Cipher:
               Master_SSL_Key:
        Seconds_Behind_Master: 8
Master_SSL_Verify_Server_Cert: No
                Last_IO_Errno: 0
                Last_IO_Error:
               Last_SQL_Errno: 0
               Last_SQL_Error:
- Slave_IO_State
- trying to connect to the master
- waiting for events from the master
- reconnecting to the master
- and so on. For a listing of possible states, see Replication Slave I/O Thread States
- Connect_Retry
- The number of seconds between connect retries (default 60).
- This can be set with the CHANGE MASTER TO statement or –master-connect-retry option.
- Master_Log_File
- The name of the master binary log file from which the I/O thread is currently reading.
- Read_Master_Log_Pos
- The position in the current master binary log file up to which the I/O thread has read.
- Relay_Log_File
- The name of the relay log file from which the SQL thread is currently reading and executing.
- Relay_Log_Pos
- The position in the current relay log file up to which the SQL thread has read and executed.
- Relay_Master_Log_File
- The name of the master binary log file containing the most recent event executed by the SQL thread.
- Exec_Master_Log_Pos
- The position in the current master binary log file to which the SQL thread has read and executed, marking the start of the next transaction or event to be processed.
- The coordinates given by (Relay_Master_Log_File, Exec_Master_Log_Pos) in the master’s binary log correspond to the coordinates given by (Relay_Log_File, Relay_Log_Pos) in the relay log.
- Seconds_Behind_Master
- This field is an indication of how “late” the slave is:
- When the slave is actively processing updates, this field shows the difference between the current timestamp on the slave and the original timestamp logged on the master for the event currently being processed on the slave.
- When no event is currently being processed on the slave, this value is 0.
- In essence, this field measures the time difference in seconds between the slave SQL thread and the slave I/O thread. If the network connection between master and slave is fast, the slave I/O thread is very close to the master, so this field is a good approximation of how late the slave SQL thread is compared to the master. If the network is slow, this is not a good approximation; the slave SQL thread may quite often be caught up with the slow-reading slave I/O thread, so Seconds_Behind_Master often shows a value of 0, even if the I/O thread is late compared to the master. In other words, this column is useful only for fast networks.
- The value of Seconds_Behind_Master is based on the timestamps stored in events, which are preserved through replication.
- This field is an indication of how “late” the slave is:
主从同步检测和监控
对于MySQL同步复制,主要是监控如下两个方面:
- 同步是否正常运行
- 同步是否存在时延
第一个层面的监控,可以从两方面进行:
- 从master的角度进行监控
- 从slave的角度进行监控
从master的角度进行监控会相对简单一些,思路是在master执行show processlist;,然后找出所有Binlog的进程,一一对比该master的所有slave是不是都有相应的进程存在。如果有,说明IO线程是正常的,否则说明IO线程挂掉了。
当然,从这个分析过程也可以看出来,这种方式只能够监控IO线程,无法监控到SQL线程。所以如果SQL线程挂掉了,这种方式是监控不出来的。但是它的好处就是简单。下面是笔者写的一个监控和自动回复脚本,大家可以参考一下:
#!/bin/bash
## arganzheng##
## zhengzhibin@baidu.com ##
## 2015-05-19 ##
## MySQL主从同步监控和自动修复同步
## 使用CT,5分钟跑一次。

## Import shell module
# determine base directory; preserve where you're running from
realpath=$(readlink -f "$0")
export basedir=$(dirname "$realpath") #export basedir, so that module shell can use it. log.sh. e.g.
export filename=$(basename "$realpath") #export filename, so that module shell can use it. log.sh. e.g.

export PATH=$PATH:$basedir/modules

. utils.sh
. log.sh
## END module import

MYSQL_DIR=/home/work/Mysql/mysql-5.1.73-linux-x86_64-glibc23
timestamp=`date +%Y%m%d%m%s`
REP_PROCESS_STATUS_FILE=/tmp/rep_process_status_$timestamp.txt

EMAIL_RECEIVERS="arganzheng@gmail.com xxx@xx.com"

cd $MYSQL_DIR
MYSQL_CONN='-uroot -pxxxxxx'
bin/mysql ${MYSQL_CONN} --skip-column-names -A -e "show processlist;" | sed 's/$/;/g' | grep 'Binlog' > $REP_PROCESS_STATUS_FILE

ERROR_COUNT=0
for slave in `get_hosts_by_path BAIDU-HK_HK-CLIENT_HK-GMOBILE_mobile_mysql-slave.HK-GMOBILE.all`; do
	grep -w $slave $REP_PROCESS_STATUS_FILE
	if [ $? -ne 0 ]; then
      log_error "$slave is not in replication process."
		ERROR_SLAVES[$ERROR_COUNT]="$slave"
    	ERROR_COUNT=$(($ERROR_COUNT+1))
    fi;
done;


if [ $ERROR_COUNT -gt 0 ];then
      log_error "monitor $ERROR_COUNT slave replication error."

      SUBJECT="mysql replication error"
      BODY=''
      CNT=0
      while [ "$CNT" != "$ERROR_COUNT" ]
      do
         BODY="$BODY ${ERROR_SLAVES[$CNT]}"
         CNT=$(($CNT+1))
      done
      BODY="$BODY is not in replication process;"

      # alert
      log_info "start alert with sms and email.. body=$BODY"
      curl -X POST -s -d "appName=mysql_monitor&sender=zhengzhibin&receivers=g_psop_gmobile_rd&title=""$SUBJECT""&content=""$BODY" "http://alarm.baidu.com/notice/sms"
      echo -e $BODY  | mail -s "$SUBJECT" "$EMAIL_RECEIVERS"
      log_info "alert done!"

      # try auto restart
      CNT=0
      log_info "trying auto restart failed replication.."
      while [ "$CNT" != "$ERROR_COUNT" ]
      do
         ssh -o StrictHostKeyChecking=no -o ConnectTimeout=10 -o PasswordAuthentication=no -o ConnectionAttempts=5 work@${ERROR_SLAVES[$CNT]} bash < /home/work/userbin/restart_slave_replication.sh
         CNT=$(($CNT+1))
      done
      log_info "auto restart replication done!"
else
    log_info "Replication OK"
fi
如果检测到slave IO线程不存在,则会远程执行restart_slave_replication.sh:
#!/bin/bash
## arganzheng##
## zhengzhibin@baidu.com ##
## 2015-05-19 ##


MYSQL_DIR=/home/work/Mysql/mysql-5.1.73-linux-x86_64-glibc23

cd $MYSQL_DIR
MYSQL_CONN='-uroot -pxxxxx'
echo "restart slave replication..."
echo "stop slave.."
bin/mysql ${MYSQL_CONN} -A -e "stop slave;"
echo "start slave.."
bin/mysql ${MYSQL_CONN} -A -e "start slave;"

echo "restart replication done"
可以看到它只是简单做了一个restart slave的过程。这是我们发现一个MySQL同步的一个诡异现象,就是在网络比较差的情况下,会出现假死状态。就是在Slave上用show slave查看会发现: Slave_IO_Running和Slave_SQL_Running都是显示Yes。但是实际上Master_Log_File和Read_Master_Log_Pos并没有变化,而且不会随着时间的迁移改变。而处理的方式也非常简单,就是在上面简单的stop slave,再start slave就可以了。
这也说明了如果要从slave出发来监控主从同步,不能简单的判断Slave_IO_Running是否为Yes,而是要检查日志文件是否在前进。但是这样子就需要有个状态的对比,实现起来比较麻烦。不过这样子也有一个好处,就是可以顺带监控同步时延,这个是单纯从master出发无法监控到的。
再来看看同步延迟的监控。通过了解MySQL的同步原理,我们知道从库和主库之间的延迟主要在两方面:
1、binlog和relaylog的差异
这个延迟主要出现在网络传输上。通过比较SHOW MASTER STATUS得到master当前binlog的最新位置<File, Position>和SHOW SLAVE STATUS得到slave的<Master_Log_File, Read_Master_Log_Pos>我们可以知道这个差异有多少字节(其实应该使用SHOW BINARY LOGS,因为可能跨文件)。
这个时延一般不大好优化,因为是网络层面的。唯一可以做的可能是减少需要同步的数据,比如Binlog_Ignore_DB,启用压缩slave_compressed_protocol。
2、IO线程写入relaylog与SQL线程读取和执行relaylog的差异
这个也就是Second_Behind_Master衡量的。可以通过比较<Relay_Master_Log_File, Exec_Master_Log_Pos>和 <Master_Log_File, Read_Master_Log_Pos> 可以得到这个字节数差异。
不过根据上面的信息,很难将这两个差异转换为具体的时延。所以我们要另外想办法。
其实有一种很简单的做法可以实现,就是在主库插入一条记录,记录插入的时间。然后这条记录会同步到从库,我们在同步拿到这条记录,比较一下当前时间就可以知道延迟是多少了。当然从库没办法直接知道记录已经同步过来,所以要轮循,所以还有一个轮循的时间差,不过设置短一些还是可以忽略的。虽然这个自己实现非常简单,不过已经有现成的工具了,我们可以直接使用——pt-heartbeat : 用于监控mysql复制架构的延迟。主要是通过在主库上的–update线程持续更新指定表上的一个时间戳,从库上–monitor线程或者–check线程检查主库更新的时间戳并与当前系统时间对比,得到延迟值。
使用还是蛮简单的,这里不赘述。但是由于整个percona-toolkit都是用perl写的,而且依赖了几个perl模块,然后perl的模块依赖安装还是非常麻烦的。。所以可能需要折腾一会。关于perl的模块安装可以参考笔者以前写的一篇文章: 如何安装perl模块。
如果你用centos系统,那么可以直接用yum安装perl模块:
yum -y install perl-Time-HiRes
yum -y install perl-DBI
yum -y install perl-DBD-MySQL
SQL线程的时延比较常见,但是也不是很好处理。一般来说在于SQL的执行效率问题。建议是开启log_slow_slave_statements,这样,在Slave上apply的SQL也有慢速SQL日志查看和定位。另外,提高Slave的内存,增加SQL线程数都是不错的优化方案。
具体可以参考这几篇相关文章:Reasons for MySQL Replication Lag、Managing Slave Lag with MySQL Replication和Fighting MySQL Replication Lag。
NOTES
- 关于MySQL同步假死问题具体可以参见:请不要用SECONDS_BEHIND_MASTER来衡量MYSQL主备的延迟时间
- 关于主从同步时延的衡量可以参考这篇:How to identify and cure MySQL replication slave lag 和 这篇:MySQL复制中slave延迟监控
补充
由于海外的服务器是CentOS 4,折腾了半天还是没能成功安装pt-toolkit,最后干脆自己写了一个shell,其实就是拿到ts,然后跟当前时间做比较而已:
#!/bin/bash
## arganzheng##
## 2015-09-23 ##
## MySQL主从同步时延监控:定时检查heartbeat记录,上报时延。

## Import shell module
# determine base directory; preserve where you're running from
realpath=$(readlink -f "$0")
export basedir=$(dirname "$realpath") #export basedir, so that module shell can use it. log.sh. e.g.
export filename=$(basename "$realpath") #export filename, so that module shell can use it. log.sh. e.g.

export PATH=$PATH:$basedir/modules

. utils.sh
. log.sh
## END module import

MYSQL_DIR=/home/work/Mysql/mysql-5.x.73-linux-x86_64-glibc23
cd $MYSQL_DIR
MYSQL_CONN='-uxxx -pxxxxx'
# shell的date命令无法解析yyyy-MM-dd'T'HH:mm:ss.SSSSSS,需要将T替换成空格(CentOS4还需要替换后边的.SSSSS)。即:yyyy-MM-dd HH:mm:ss
HEART_BEAT_TS=`bin/mysql ${MYSQL_CONN} --skip-column-names -A -e "SELECT ts FROM test.heartbeat " | sed 's/$//g' | sed 's/T/ /g' | cut -d. -f1`

# parse ts to second
TS_IN_SECOND=`date -d "$HEART_BEAT_TS" "+%s"`
NOW_IN_SECOND=`date "+%s"`

REPLICATION_DELAY=$((NOW_IN_SECOND - TS_IN_SECOND))

echo "mysql.replication.delay:${REPLICATION_DELAY}"
这里把delay值以key-value的形式打印出来,NOAR平台会定时采集自定义监控项。然后就可以在NOAR上配置监控报警条件了。
参考文档
- REPLICATION TROUBLESHOOTING - CLASSIC VS GTID
- One Advantage of MySQL Statement-based Replication
- row-based replication (RBR)
- Advantages and Disadvantages of Statement-Based and Row-Based Replication
- Known Issues in MySQL Cluster Replication
- MySQL复制中slave延迟监控
- Checking Replication Status
- 请不要用SECONDS_BEHIND_MASTER来衡量MYSQL主备的延迟时间
- How to identify and cure MySQL replication slave lag
- How does MySQL Replication really work?